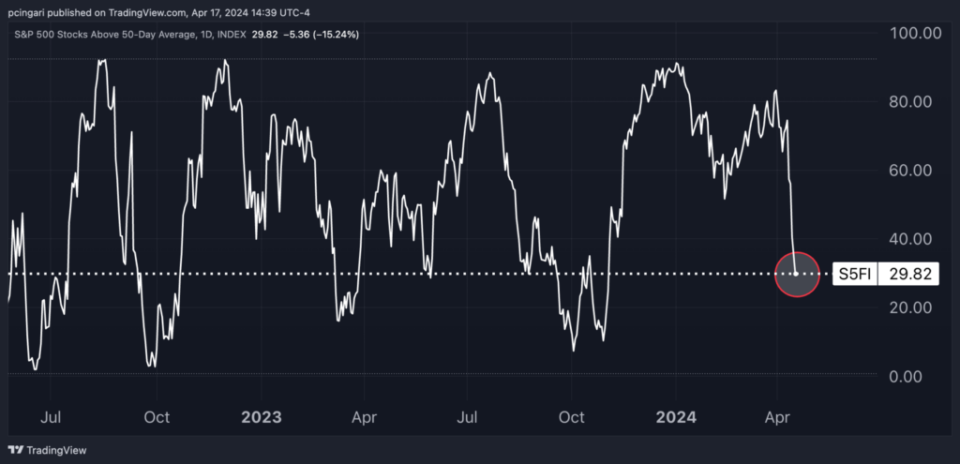
For the first time since early November 2023, less than 30% of S&P 500 stocks are trading above their 50-day moving average — a clear indicator of the current poor market’s breadth.
This significant drop from the 85% observed in late March and 92% at the beginning of January highlights a dramatic reversal in market dynamics.
The 50-day moving average is often seen as a barometer for the short-term health of stocks. Falling below this level en masse suggests that a broad swath of the market is facing downward pressure.
This shift comes amid escalating geopolitical tensions in the Middle East and renewed concerns over inflation, which have collectively nudged traders towards a more guarded stance in April.
On Wednesday, the SPDR S&P 500 ETF Trust (NYSE:SPY) closed 0.3% lower, marking its fourth straight session in the red. That’s the longest losing streak since early January.
Chart: Less Than 30% of S&P 500 Stocks Trade Below 50-Day Moving Average
Inflation Concerns
March saw inflation rates rise to 3.5%, overcoming economist expectations and continuing a three-month trend of increases.
“The recent data have clearly not given us greater confidence and instead indicate that it is likely to take longer than expected to achieve that confidence,” Powell said Wednesday.
That sounded like an official delay to rate-cut hopes. With inflation proving stubborn, the outlook for interest rates has shifted significantly.
Futures markets are now anticipating roughly 40 basis points in cuts by the end of the year, or less two quarter-percentage points Fed rate cuts.
S&P 500 Outlook: Heading To A Correction?
Investment analysts are closely watching these market developments.
Veteran investor Ed Yardeni recently predicted a potential retest of the S&P 500’s 200-day moving average around the 4700 level, which would represent “a classic 10% correction.”
“The S&P 500 is experiencing its first real bout of volatility this year,” said Adam Turnquist, chief technical strategist for LPL Financial.
The index has seen a 3.9% decline in April, which has begun to “create some technical damage.” Notably, the S&P 500 has breached its shorter-term uptrend and fallen below its “20- and 50-day moving average (dma),” positioning the 5,000-point mark as the next critical support level.
Turnquist highlighted that longer-term breadth indicators are more robust, with “nearly 70% of S&P 500 constituents remain above their 200-dma.”
“The lack of major damage to longer-term breadth across the offensive sectors suggests bullish leadership is still on stable ground despite the recent shakeout,” he added.
Stephen Suttmeier, technical strategist at Bank of America, highlighted that 12 consecutive months of positive year-over-year returns for the S&P 500 could portend well for the future.
Data suggests that if this trend continues for at least 20 months, the index could see a rise of up to 17.1% (6,150 points) by November 2025.
However, Suttmeier warned of near-term risks. The S&P 500’s struggle to surpass the mid-5,200s, amid typical election year volatility in April and May, points to possible near-term challenges.
Support levels at 5,000, 4,800, and 4,600 will be crucial if the index falters.
The lack of deeply oversold conditions, as indicated by the three-month VIX relative to historical levels and the percentage of stocks above their 50-day moving averages, suggests that the market might need further corrections to establish a more robust low.
Image: Shutterstock
“ACTIVE INVESTORS’ SECRET WEAPON” Supercharge Your Stock Market Game with the #1 “news & everything else” trading tool: Benzinga Pro – Click here to start Your 14-Day Trial Now!
Get the latest stock analysis from Benzinga?
This article Most S&P 500 Stocks No Longer Trade Above 50-Day Average: Healthy Pullback Or Is The Bull Market Over? originally appeared on Benzinga.com
© 2024 Benzinga.com. Benzinga does not provide investment advice. All rights reserved.

Jessica Roberts is a seasoned business writer who deciphers the intricacies of the corporate world. With a focus on finance and entrepreneurship, she provides readers with valuable insights into market trends, startup innovations, and economic developments.