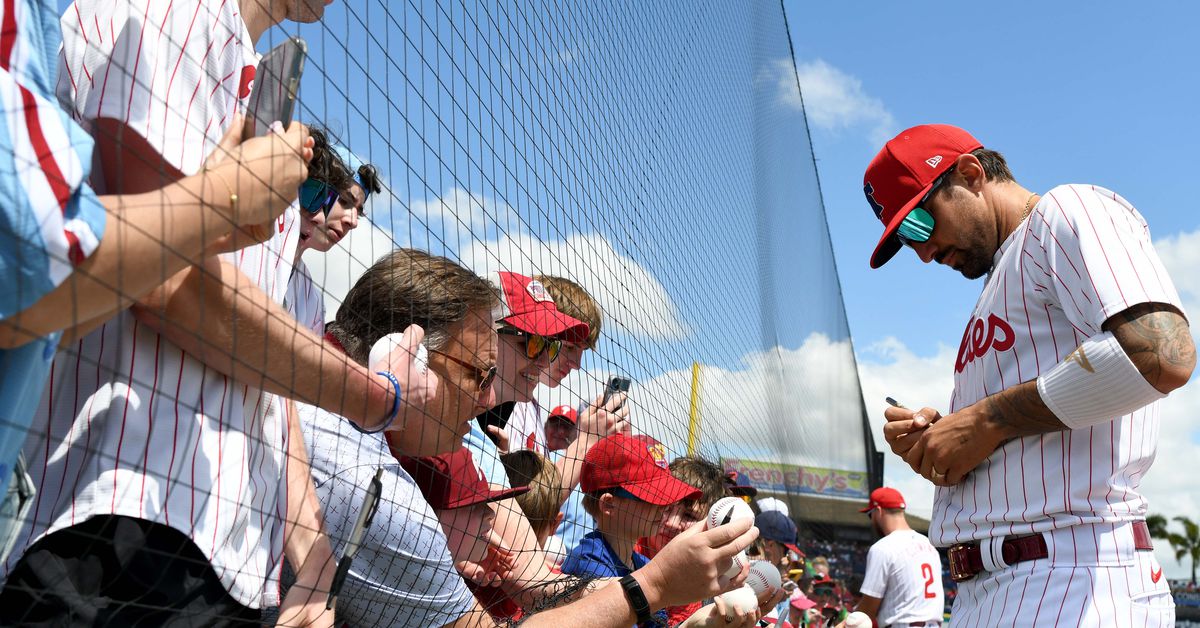
The Phillies started Spring Training well enough, with a 4-2-3 record over the first 8 days. Things went downhill from there however, going 5-13-4 the rest of the way, including a particularly uninspiring finish:
#Phillies ended Spring Training on a 1-7-4 skid.
Since 2006* the only other time they won only 1 of 12 in ST was 1-10-1 from late March 2023 through early March 2014.
Never did it in a single Spring over that time.
*when records begin#meaninglessbutnoteworthy@thegoodphight
— schmenkman (@tgpschmenk) March 27, 2024
They finished with 9 wins, tied for the fewest in all of MLB. That was partly because they also had an ungodly number of ties, the most on record (since 2006) by a team in Florida’s Grapefruit League (and matched or beaten in ST only by the 8 posted by the 2015 Dodgers).
Discussions in this and other forums have often included concern about the Phillies’ lack of winning, and especially their lack of offense:
They finished the Spring 27th in runs per game (4.13), 29th in BA (.231), 30th in OBP (.300), 29th in Slugging (.361), and 30th in OPS (.661).
And if we were hoping to at least see signs of improvement in their approach, the Spring stats showed nothing of the sort: 25th in Walk rate (8.0%), 30th in Walks per K (0.27), and as one might see coming, the highest K rate in MLB (29.4%).
The point is often made though that there are many reasons to take Spring stats with a grain of salt. Both pitchers and hitters are trying new things that they would never do in games that count, players involved are a roiling mix of major leaguers and guys slated to start the year in AA or AAA, and on top of it all, 31 games or so is always a small sample and difficult to draw any conclusions from.
As a result, many focus on the last week of Spring Training: many of the minor leaguers have been sent to their respective camps, we see more of the major leaguers, and those games should, theoretically, be a better gauge of what’s to come for each team.
In order to research how rare that 1-7-4 skid was, I had to build a log of all Phillies Spring games dating back to 2006, which is when MLB.com starts listing Spring game-by-game results. That log allows us to do some quick analysis to see whether the last week of each Spring really does indicate how well a team will start the season.
We can’t use 2024 of course since we don’t have a regular season to compare it to, and we’re going to throw out 2020 because there were only 3 “Summer Camp” games, and it was all very weird anyway. So that leaves us with 17 years with which to compare the last week of Spring Training, to the start of the season: 2006-19 (14 years), plus 2021-23 (3).
And as for the start of the regular season, we could focus on the first week, say, which would provide some symmetry with the last week of Spring. However rather than relying on yet another small sample, we’ll use all of March/April. After all, if they do great for a few games in the first week, but crater for the rest of the month, we wouldn’t care much about those first few games.
Over the last week specifically, they were 1-4-2. Their pitching wasn’t great, allowing 5.00 runs per game, and their offense was still sputtering, averaging a measly 3.29 runs. Even if we’re comfortable that Wheeler, Nola, Ranger, and the rest of the pitching will perform as expected, shouldn’t we be worried that the offense hasn’t gotten any traction yet, even with the regulars playing more recently?
I can’t tell you whether to worry or not, but we can say that there is no evidence of correlation between the team’s last week of the Spring and their first month of the regular season.
Let’s start with the lack of winning.
Won-Lost Record
The correlation between winning percentage in the last week of Spring Training and the first month of the regular season was:
-0.25
As a reminder, the “correlation coefficient” ranges from -1.00 to 1.00. Numbers close 1.00 indicate strong correlation that the two sets of numbers move together. Negative numbers close to -1.00 indicate strong negative correlation (numbers move in opposite directions), and anything close to 0 means there is little or no correlation.
So that’s right, there was some correlation in W-L %, but the opposite from what we might expect – it wasn’t a strong effect, but the better the team did in late March, the worse it did when games started counting.
Offense
There was at least some positive correlation between scoring in the last week of Spring and in the first month of the season – but it was so tiny as to be nearly nonexistent:
0.09
Pitching/Defense
In runs given up, the correlation again was negative, with more runs given up to end Spring Training aligning with fewer runs in March/April.
-0.19
And this is worth clarifying for runs allowed, as well as for the offense – it’s not the weather. We are not comparing the actual numbers of runs scored or allowed, but the degree to which numbers in the Spring moved up or down in concert with numbers in the regular season.
Summary
With only 17 points to compare we can’t claim this is some rigorous exercise. Limiting the Spring Training view to just the last week makes sense in controlling to some extent for the talent level and player preparedness, but it also exacerbates what’s likely the bigger issue with ST stats, i.e. it makes the sample size that much smaller and prone to random variance.
And even if we did have enough data to call it conclusive, the Phillies could still have a terrible month and season.
That’s why they play the games, as they say – we (most of us anyway) expect that the Phillies will contend and make another run in the postseason, but none of us really has any idea.
Now play ball!

Sarah Wilson is your guide to the latest trends, viral sensations, and internet phenomena. With a finger on the pulse of digital culture, she explores what’s trending across social media and pop culture, keeping readers in the know about the latest online sensations.